用VBA把二维表转为一维表。
There could be alternative ways to analyze triangle data in
Python.
But initially, I'd like to convert the triangle data to a table. The
table can then be analyzed with Python.
The following is a triangle data set:
Each blue cell has three attributes:
ValuationYear: The time in which conducting valuation.
AccidentYear: The time in which the claim happened.
OccurenceYear: The time in which the number in the cell
occured.
The attributes for the selected cell are:
ValuationYear: 2020
AccidentYear: 2018
OccurenceYear: 2020
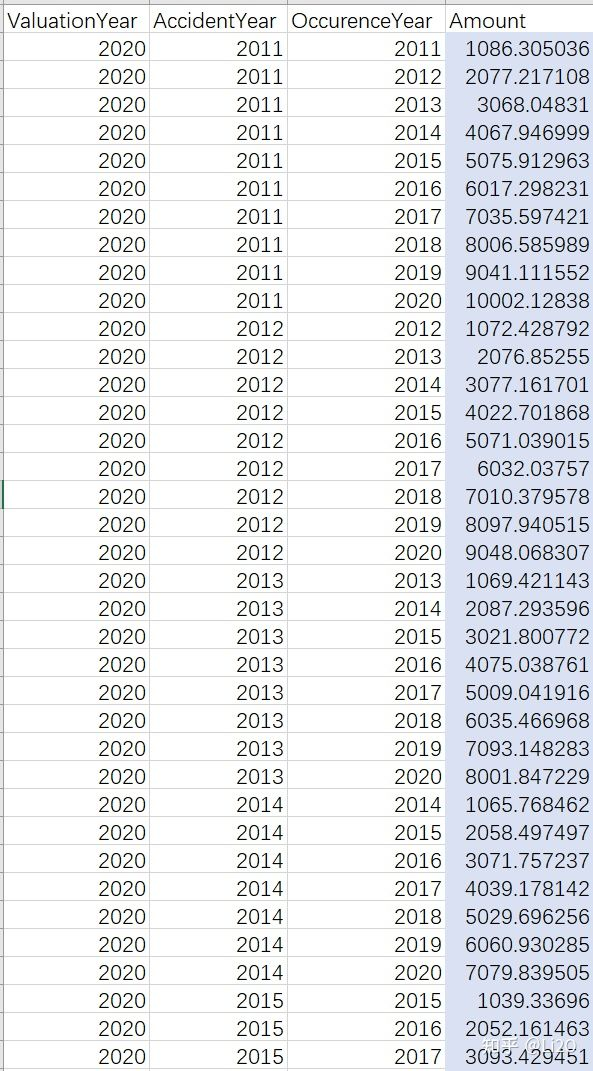
This is the final table I'd want to see:
Here is the VBA code:
1
2
3
4
5
6
7
8
9
10
11
12
13
14
15
16
17
18
19
20
21
22
23
24
25
26
27
28
29
30
31
32
33
34
35
36
37
38
39
40
41
42
43
44
45
46
47
48
49
50
51
52
53
54
55
56
Sub angletotable()Dim wb1 As WorkbookSet wb1 = ThisWorkbookDim rg As RangeSet rg = SelectionDim countrows As Integer countrows = rg.Rows.Count Dim vy As Integer vy = rg.Cells(countrows, 0 ).Value Dim wb2 As Workbook, sht As WorksheetSet wb2 = Workbooks.AddSet sht = wb2.Worksheets(1 )With sht .Name = "Table" .Range("A1:D1" ) = Array("ValuationYear" , "AccidentYear" , "OccurenceYear" , "Amount" ) End With sht.Range("A" & Rows.Count).End (xlUp).Offset(1 ).Resize((countrows ^ 2 + countrows) / 2 , 1 ) = vy Dim rgi As RangeDim i As Integer Dim lastrow As Long Dim ay As Integer For i = 1 To countrows Set rgi = rg.Cells(i, 1 ).Resize(1 , countrows + 1 - i) rgi.Copy sht.Range("D" & Rows.Count).End (xlUp).Offset(1 ).PasteSpecial Transpose:=True ay = rgi.Cells(1 , 0 ).Value sht.Range("B" & Rows.Count).End (xlUp).Offset(1 ).Resize(countrows + 1 - i, 1 ) = ay For j = 0 To countrows - i sht.Range("C" & Rows.Count).End (xlUp).Offset(1 ) = ay + j Next j Next iEnd Sub
The VBA can be assigned to a button. There will be two setps to use
this VBA.
Select the retangular area that contains the triangle,
Click the VBA button.
PS: The accident year data in the let hand side of the triangle is
necessary.


