运用 Python 的 Bokeh 包进行财险数据交互式可视化。
导引
继 Alonso 上篇用Python分析财险数据——菜鸟向,我对同样的数据用 Bokeh server 进行了可视化。
Bokeh简单介绍:Bokeh 是 Python 的一个制作交互式可视化工具的包,R 中也有相应的包叫做 shiny (https://shiny.rstudio.com/)。Boken 目前对中文的支持不太友好,但本文我们将用 JS 将网页语言改变为中文。Boken 有两种用法:
- 第一种是不利用 Bokeh server,这种情况下能做出好看的交互图,实现拖曳,放大,鼠标悬浮标签等功能。最后能够生成静态的HTML文件。
- 第二种是利用 Bokeh server,做一个 Web application。这种情况下能实现数据筛选调用等更多功能。一般使用 Flask + Bokeh,把 Bokeh 放置于 Flask application 里面。我们的这个例子中没有使用 FLask,而用了一个默认的 HTML 模板,叫做 Jinja,很多可以修改的功能被限制了。
本文介绍的是第二种,Bokeh server 的 Web application 应用示例,代码基于 Bokeh Gallery 里面的两个 sample。一个是 movie,一个是 crossfilter,链接见文末的参考文献。
先来示范一下效果:
- 筛选数据功能:

- 拖曳,选择,数据标签功能:

- 通过拖曳点的方式修改数据的功能:

该交互式图表目前 host 于http://49.234.103.189:5006/test 这个网页中。
步骤
安装 Bokeh
pure python 用户打开命令行: 1
pip install bokeh
1
conda install bokeh
文件树
我们需要的文件树大概是这样的结构:
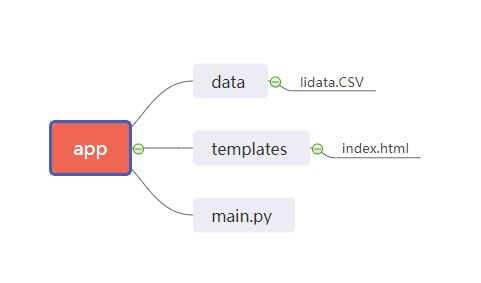
app 文件夹下有三个文件:一个是 main.py,是我们的 python 主文件;另一个是 templates 文件夹,里面放 index.html,是我们对于基本 html 框架的补充;还有一个是 lidata.csv,是我们的数据源文件。
分析数据
我们要根据公司,险种,险别来进行数据筛选,因此,我们首先要得到这几列有哪些情况。
1
2
3
4
5
6
7
8
# lidata就是Alonso的数据集
df_all = pd.read_csv(r'./app/data/lidata.CSV', header = 0)
# 计算ULR
df_all['ULR'] = df_all['UL'] / df_all['EP']
# 加入all是为了能够选择所有情况
unique_company = ["All"] + df_all['公司'].unique().tolist()
unique_business = ["All"] + df_all['险种'].unique().tolist()
unique_product = ["All"] + df_all['险别'].unique().tolist() 1
2
3color = pl.mpl['Plasma'][len(unique_product)]
#这里Plasma是一个Bokeh自带的调色盘,帮助我们找到好看的配色
df_all["color"] = [color[unique_product.index(pro)] for pro in df_all["险别"].values]1
2year_start = df_all['事故年'].min()
year_end = df_all['事故年'].max()
最后一个要准备的是要展示的数据y列是什么。这里需要做一个字典用来对应选项和数据列名的关系。
1
2
3
4
5axis_map = {
"ULR": "ULR",
"ULAE": "EP",
"DAC":'DAC'
}
接下来就是作图啦。图分为左右两边。左边的部分叫做 control,右边的部分叫做 plot。
制作control
1 | # year_range: 展示的事故年范围 |
制作plot
1 | # Tooltips用来制作鼠标悬浮于数据时的数据标签 |
更新数据
1 | def select_products(): |
生成图
1 | # input就是图左边的control |
templates文件夹:利用Bokeh自带Jinja模板对网页更改基本样式
这个时候就要用到templates文件夹啦!它里面的index.html是对于jinja模板的补充。
Jinja模板如下,这个我们没有办法改,想要改的话只能用JS在后面改。
1
2
3
4
5
6
7
8
9
10
11
12
13
14
15
16
17
18
19
20
21
22
23
24
25
26
27
28
29
30
31
32
33
34
35
36
<html lang="en">
{% block head %}
<head>
{% block inner_head %}
<meta charset="utf-8">
<title>{% block title %}{{ title | e if title else "Bokeh Plot" }}{% endblock %}</title>
{% block preamble %}{% endblock %}
{% block resources %}
{% block css_resources %}
{{ bokeh_css | indent(8) if bokeh_css }}
{% endblock %}
{% block js_resources %}
{{ bokeh_js | indent(8) if bokeh_js }}
{% endblock %}
{% endblock %}
{% block postamble %}{% endblock %}
{% endblock %}
</head>
{% endblock %}
{% block body %}
<body>
{% block inner_body %}
{% block contents %}
{% for doc in docs %}
{{ embed(doc) if doc.elementid }}
{% for root in doc.roots %}
{{ embed(root) | indent(10) }}
{% endfor %}
{% endfor %}
{% endblock %}
{{ plot_script | indent(8) }}
{% endblock %}
</body>
{% endblock %}
</html>
index.html 的基本格式如下: 1
2
3
4
5
6
7
8
9
10
11
12{% extends base %}
<!-- goes in head -->
{% block preamble %}
<link href="app/static/css/custom.min.css" rel="stylesheet">
{% endblock %}
<!-- goes in body -->
{% block contents %}
<div> {{ embed(roots.scatter) }} </div>
<div> {{ embed(roots.line) }} </div>
{% endblock %}1
2
3window.onload = function() {
document.querySelector("html").lang = "zh";
};
运行
在命令行中先 cd 到 app 所在文件夹,并输入: 1
bokeh serve app
1
bokeh serve --show app
1
bokeh serve --log-level=debug app
1 | python3 -m bokeh serve app |
完整代码在github: https://github.com/Mengkee/bokeh_example
参考文献
本文采用 署名-非商业性使用-相同方式共享 4.0 国际 许可协议,转载请注明出处。


